Indicators of the coronavirus COVID-19 outbreak development
(A.B. Alyokhin, B.V. Burkynskyi, A.N. Grabovoi, V.A, Dilenko, N.I. Khumarova)
Statistical Monitor
09/07/2020. No 112.
https://www.facebook.com/ab.alyokhin/posts/160335408942696
Today we publish a summary of the status of progress indicators for the IP epidemic of the coronavirus COVID-19 in the world and in a number of countries, including Ukraine, according to official statistics as of July 9, 2020.
During the reporting day, the COVID-19 epidemic of coronavirus in Germany, Israel, France, South Korea, and Japan did not show positive dynamics of progress (Fig. 1–3). These are all countries that are actively pursuing a policy of weakening quarantine and in this regard are experiencing some difficulties in preventing the second wave of the epidemic.


The three leaders of our rating on the reporting day demonstrated the following indicators of the development of epidemics.
In China, the mortality rate I (TC) decreased by 0.01% (5.54%), the mortality rate I (CC) did not change (5.57%), the value of the IP progress indicator increased by 0.01% (99 , 53%). These changes were the result of a small number of new cases (7 people) and a higher level of recovery (20 people).
In Germany, the mortality rates I (TC) and I (CC) did not change (4.59% and 4.75%, respectively), but the value of the IP progress indicator decreased by 0.20% (96.50%) due to the absence of convalescent past reporting day.
In Italy, the mortality rate I (TC) did not change (14.42%), the mortality rate I (CC) decreased by 0.05% (15.28%). As a result, the value of the IP progress indicator increased to the level of 94.39% against 94.11%. This result became possible due to the large number of people who recovered during the reporting day (825 people).
The global ranking of epidemics and pandemics in the world is shown in the diagram in Fig. 4. During the reporting day, Brazil surpassed Russia in the ranking, and Ukraine — USA, pushing each of these countries down one position.

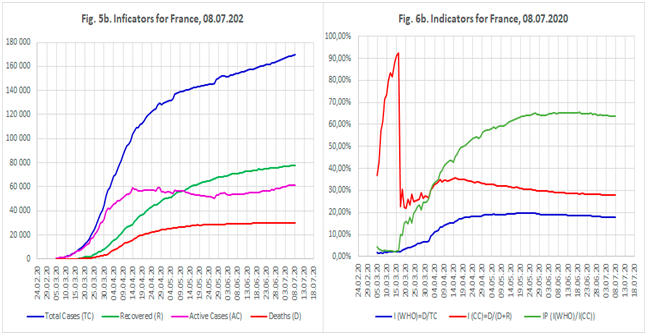
Today in fig. 5–9 are charts characterizing the dynamics of the actual values of the main indicators of the epidemic of the coronavirus COVID-19 in Ukraine and France, in a country that slowly but consistently limits the spread of coronavirus.
As you know, the statistics on the total number of infected people are greatly influenced by the number of tests carried out and the conditions for their implementation. In some countries, according to many experts, this can serve as a tool for manipulation.
For the whole dissimilarity of the epidemic development processes in Ukraine and France, the number of tests performed per 1000 people (see https://ru.wikipedia.org/wiki/%D0%A2%D0%B5%D1%81%D1%82% D0% B8% D1% 80% D0% BE% D0% B2% D0% B0% D0% BD% D0% B8% D0% B5_% D0% BD% D0% B0_% D0% BA% D0% BE% D1% 80% D0% BE% D0% BD% D0% B0% D0% B2% D0% B8% D1% 80% D1% 83% D1% 81% D0% BD% D1% 83% D1% 8E_% D0% B8% D0% BD% D1% 84% D0% B5% D0% BA% D1% 86% D0% B8% D1% 8E_COVID-19 # cite_note-covid-testing-67) is very low in these countries.
Comparison of diagrams in fig. 5 clearly shows the qualitative difference between the epidemics of coronavirus in Ukraine and in France. In France, the scale of the epidemic is much larger, but the growth of the main indicators of the epidemic has slowed down quite quickly and has been showing low rates for a long time. In contrast, in Ukraine these indicators continue to grow rapidly.
The dynamics of the values of progress indicators in both countries (Fig. 6) are quite similar. However, in Ukraine this is achieved due to high rates of recovery against the background of high rates of new cases, which also significantly distinguishes the compared epidemics.

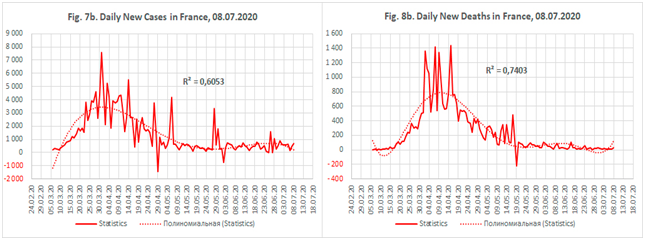
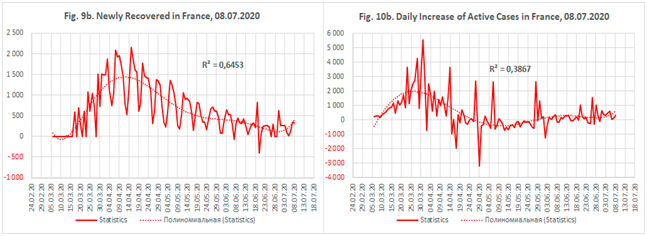
The trajectories of daily epidemic indicators (Fig. 7b-10b) in France have a classic appearance, characteristic of epidemics taken under control at a certain moment. In this case, it is somewhat delayed in time, as evidenced by the shape of peaks with relatively gentle slopes. These diagrams also show insignificant costs of quarantine weakening, expressed in the presence of insignificant local rises of the corresponding curves in recent weeks.


The trajectories of daily epidemic indicators in Ukraine (Fig. 7a-10a) demonstrate the absence of active suppression of the spread of coronavirus at the first stage of the epidemic development (the peak, which did not form, transformed into a plateau (Fig. 7a)) and the presence of the second epidemic wave. All these are obvious costs of managing the development of the epidemic. Nevertheless, in recent days, positive trends have been observed in the dynamics of the total number of new infections, recoveries, and active cases (Fig. 8a-10a). How much they are market and / or man-made, time will tell.
___
Note.
A progress indicator (IP) of 1.00 indicates the end of the epidemic in the relevant region, i.e. at the time when there are no new infected, current patients are absent, all previously infected have replenished the lists of recovered and dead.
Figure 1 shows the values of the IP progress indicator for all countries of the world together taken from China, countries of the world with the exception of China and several other countries.
Diagram 2 shows the “leaders” from among the analyzed regions and countries.
Diagram 3 shows the “average”.
The terms “leaders” and “average” are used solely to differentiate countries and regions according to the level of the IP epidemic progress index and place them in different charts for easy viewing and visual comparison.
At the time of the end of the epidemic, the values of both mortality rates should be equal.
Mortality rates widely used in medical statistics are not capable of sufficiently informatively reflecting the dynamics of the epidemic development process at the initial stage. In contrast, the progress indicator IP captures changes in the development of epidemics quite accurately and informatively throughout the entire life cycle of the epidemic.
Sources of statistics:
https://www.worldometers.info/coronavirus/#countries
https://www.pravda.com.ua/cdn/covid-19/cpa/
Our materials also:
https://www.facebook.com/MATHMODELCOVID19
The accuracy of our forecasts:
https://www.facebook.com/ab.alyokhin/posts/154698732839697 (Germany)
https://www.facebook.com/ab.alyokhin/posts/142548897388014 (Spain)
https://www.facebook.com/ab.alyokhin/posts/150095069966730 (Italy)
https://www.facebook.com/ab.alyokhin/posts/148450556797848 (USA)
https://www.facebook.com/ab.alyokhin/posts/154364292873141 (Ukraine)
https://www.facebook.com/ab.alyokhin/posts/144983953811175 (France)
https://www.facebook.com/ab.alyokhin/posts/152284093081161 (South Korea)
Publications on mortality and progress indicators:
https://www.facebook.com/ab.alyokhin/posts/105684827741088